
Looks like there are cases where a job fails, and throws an exception, but it just keeps running forever in the background. It happens to us a couple of times already. In the web UI interface the job indicator never change from blue (running) to red, even though when we click on the specific sub-jobs, they are all red.
We tried to kill it via the "kill" button in the interface, but it doesn't work. Looks like the only thing that works is to restart the clover server, and that sometimes gets messy and we can't bring the server up again because of initialization errors.
Is there a way to manually force a specific job that is been running forever to stop via API calls or some other means, other than restarting the server?
-
Hi ramiro,
I think we should focus on what causes the graphs to get stuck instead of trying to kill them afterwards. Could you please tell me more about the jobs? Any detail could be important. Are they always the same jobs? Can you share the graphs and the exceptions they throw with me? Are there any special circumstances (server overload, too many running graphs, network connectivity issues, ...) when the job gets stuck? How were the jobs started? From Designer? From Web GUI? By a listener or scheduler? And what is the version of CloverETL you use?
Thanks. -
Hi imriskal,
Thanks for the response. It is not always the same jobs, but the same db connection that fails.
The database is an external, third party resource hosted in Amazon, and it works 90-95% of the time. We do run a lot of jobs though, so we see this connection error often.
The error happens in different graphs, but it is about the same:
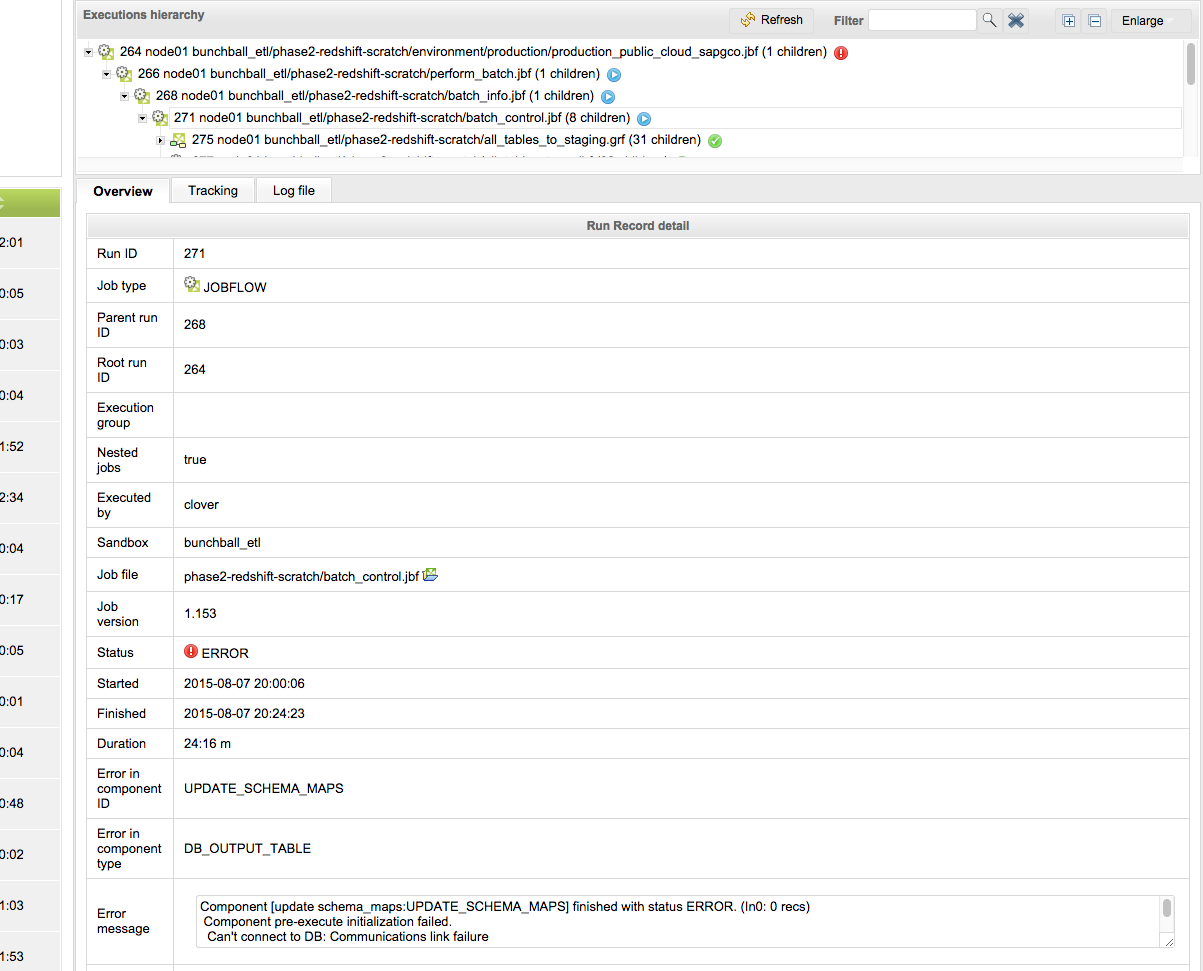
"Component [update schema_maps:UPDATE_SCHEMA_MAPS] finished with status ERROR. (In0: 0 recs)
Component pre-execute initialization failed.
Can't connect to DB: Communications link failure
The last packet sent successfully to the server was 0 milliseconds ago. The driver has not received any packets from the server.
clover.ouramazontinstace.us-west-2.rds.amazonaws.com: Name or service not known"
We are not 100% sure yet, but it seem to happen when we have too many running graphs all hitting the same resource (from different jobs / servers).
The jobs themselves are started on a schedule, via the web admin interface, they run every 20-30 minutes, and if one of them fail, our idea was that it will be ok, since the next job will just pick up in the next run. We are using the max_running_concurrently = 1 param because our data will get messed up if the same job run as the one that run prior haven't finished. Problem is: when one fails but cloverETL don't mark it as red, max_running_concurrently will prevent others from start, and our ETL process gets behind.
In most cases, when we fail to connect to the amazon db, the "Communication link failure" error bubbles up correctly, the graph is marked red (as failed), and we are ok with the fail, because we have the same job running on a schedule that will continue from where the failed one left off. But eventually, one of every 100, we get one that refuses to be marked as red, and just messes everything up.
The reason we are focusing on somehow killing the rogue jobs instead of trying to make the db connection more reliable is because since it is a external resource, and it works almost all of the time, I am not sure there's more we can do in that area. We do run A LOT of jobs, so eventually we will get exceptions in connecting, even if their success rate is 99%+
The only way we know of that we can kill those rogue jobs for sure is to restart the cloverETL server, but that sometimes end up in Initialization failure errors, which take us longer to recover. We are going to start playing with the max_graph_instance_age param to see if that will be effective in force killing those, but since the "kill" command via the admin interface don't seem to work, our expectations are low. Attached is an image on how things look when this happens, you can see the sub-graphs green, the parent graph blue, and yet there is an error reported in red, but the status of the graph never changes from blue to red.
We are using CloverETL Server 3.5.2.12/12. Any help / advice will be appreciated. Thank you
Ramiro
Screen Shot 2015-08-10 at 10.41.08 AM.png -
Ramiro,
Thank you for such a detailed report. I think max_graph_instance_age will not help you.
max_graph_instance_age = Time interval in ms which specifies how long may transformation instance last in server's cache. 0 means that transformation is initialized and released for each execution. Transformation cannot be stored in the pool and reused in some cases (transformation uses placeholders using dynamically specified parameters)
We have seen similar issues a few times already. A graph usually got stuck after some issues with DB connections. Either the DB connection was lost or a timeout appeared or a firewall blocked the connection or the DB server could not handle another connection. CloverETL graphs open a network socket on the OS level when they want to communicate with a DB. And when some query takes too much time, it is sometimes hard to tell whether it is because the query is just too complex or there is an issue with the connection itself. OS therefore not always closes the connection but waits for any response instead. And when the connection remains open, we can not kill the graph.
Third party services like Amazon or NetSuite are quite often the source of these troubles. I do not know whether they have some artificial limit for overall number of connections you can use at once or they are just unreliable sometimes so it is hard to tell what could help you in this situation. I would definitely try at least the following two changes:
1) Change your standard JDBC connection to JNDI if you have not done it yet. In JNDI, you can set parameters like limit for active connections, validation query, validation interval etc. which could help you avoid the error in some situations. Here is a documentation page describing the configuration process for our most common application server - Tomcat.
2) Change keepalive settings on the machine running CloverETL Server. But be very careful. If you set it incorrectly, you can affect many other things starting with errors appearing during too complex queries and ending with unability to connect anywhere. The default value of tcp_keepalive_time is 7200 (=2 hours), I would try to set it to for example 600 (=10 minutes) and restart the machine. If 10 minutes are not suitable, try other values based on duration of your DB queries. This should ensure more frequent keepalive messages between OS and DB which should then help with quicker recognition of any network troubles.
Beside that, some databases like MySQL or PostgreSQL support autoReconnect=true in JDBC URL. I see you use Redshift, maybe it has some similar setting.
And by the way, when you mentioned the status of the graph never changes to red, did you try to click on the Refresh button above the execution hierarchy?
Let me know with the results, please. -
One more note, there is a utility named gdb able to close file descriptor in Linux, see StackOverflow. If you find PID of Java process running the graph and file descriptors open by this process, you can close the descriptor using the mentioned utility which should allow CloverETL Server to stop the graph.
I hope this helps. -
Thanks for all the details! Yes, Amazon has a limited number of connections available, and yes, sometimes we do exceed them. So most likely that is the reason why the connection reminds open.
Regarding the blue not turning to red, yes, we tried the refresh button, reloading the entire page, filtering to just that job, and even trying to kill it from the Monitoring tab, Running jobs (10 longest running) section, Suspend at Once and Resume buttons, but none of them worked or made it become red. but I'm sure a combination of the recommended workaround listed above will help. Thank you.
Ramiro

Please sign in to leave a comment.
Comments 5