
Hello.
Is there any way to get set of data records that passing through edge between component when the graph is executing, like in clover designer, without code instrumentation?
Is there any way to get set of data records that passing through edge between component when the graph is executing, like in clover designer, without code instrumentation?
-
Hi,
This functionality in the Designer is called "debug mode" and it is set to "true" by default in case you run the graph from the Designer. If you want the debug data to be saved even though you have not started the graph directly from the Designer, you have to set a property debug_mode to "true" explicitly.
In the Server console, this can be handled by using configuration properties available for a job or the whole sandbox (see Job Config Properties chapter in the documentation).
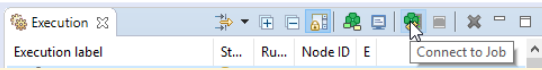
The data are then stored by default in <java.io.tmpdir>/clover_temp_node01 directory in the folder named after Run ID (the exact path can be viewed and updated in the Server console -> Configuration -> Temp Spaces). Or you can review the data back in the Designer by connecting to the specified Run ID:
connecttojob.PNG
Have a nice day, Eva -
Hi Rifttech,
I am a little bit on the fence as to what exactly you are looking for. Typically, when it comes to debugging data within the CloverDX framework, the data can be either viewed directly in the Designer or as Eva mentioned previously, the edge debug data can be pulled from the debug files. Producing the debug files is a viable option in our open source engine as well. This is an example of how the debugging can be turned on:<Edge debugMode="all" fromNode="UNIVERSAL_DATA_READER:0" guiBendpoints="" guiRouter="Manhattan" id="Edge0" inPort="Port 0 (in)" metadata="Metadata0" outPort="Port 0 (output)" toNode="REFORMAT:0"/>
After the graph run, debug files (*.dbg) will be generated (by default) in the Java temp directory and since they contain binary data they need to be further read by CloverDataReader.
Another simpler option is to modify your graph in a way that you fork the data flow at the desired point by SimpleCopy component and write it to some temp file using a writer component.
If none of these options is what you were looking for, kindly clarify a couple of additional details:- By the Java application, do you mean the CloverDX Designer or a different Java application that you develop?
- If the latter is the case, how do you execute the graph? For instance, by using the runGraphclass.
- Could you elaborate on which part of your transformation requires the edge debug data and how you intend to use them?
- You mentioned that you want to get the data passing through the edge between connected etl components from java code. Could you elaborate more on the "from Java code" part of your question?
Best regards, -
Hi, thanks for reply.
The graph runs similar way like runGraph#executeGraph method.
Debug files and EdgeDebugReader class fully statisfied my requirements.
I was wondering maybe some kind of listener exists in engine for this purpose.
Thanks for your help, much obliged.
Best regards, Arthur


Please sign in to leave a comment.
Comments 4